Chapter Roadmap
🧭MULTIPLIER
(ΔI → larger ΔY)
ACCELERATOR
(ΔY → larger ΔI)
MULTIPLIER-ACCELERATOR INTERACTION
BUSINESS CYCLES
Theme: built on Chapter 6's C-S-I foundation. "Spending of one is income to the other" – a small initial change in investment sets off a chain reaction that changes total output by a MULTIPLE amount (Multiplier); conversely, a change in consumer demand triggers an even larger, magnified change in investment (Accelerator). Together, their interaction explains the recurring boom-bust pattern known as the Business Cycle.
Key Definitions
📘Investment Multiplier (k)
Ratio of change in total output to change in investment (ΔY/ΔI) – the number by which a change in investment must be multiplied to get the final change in output.
Positive Multiplier
A greater increase in final output resulting from a small increase in investment.
Negative Multiplier
A greater fall in final output resulting from a tiny decrease in investment.
Tax Multiplier (Kt)
Measures the change in a country's total output in response to a change in government tax.
Accelerator (β)
Numerical value of the relation between an increase in income/demand and the resulting increase in investment: β = ΔI/ΔY.
Capital-Output Ratio (C.O.R.)
Amount of capital required to produce one unit of output.
Time Lag
A delay between an economic action and its consequence (relevant to both multiplier and accelerator effects).
Business Cycle
Recurring fluctuations of output that an economy experiences over a long period of time.
The Multiplier – Formula & Derivation
🧮INVESTMENT MULTIPLIER
k = ΔY ÷ ΔI (or) ΔY = k(ΔI) (or) k = 1÷(1−MPC) = 1÷MPS
Since MPC + MPS = 1 ⇒ 1−MPC = MPS | Considers only exogenous/autonomous investment change
Derivation (geometric series): ΔY = ΔI + ΔI(MPC) + ΔI(MPC)² + … = ΔI × [1÷(1−MPC)]
Worked example: Initial investment Rs.1000m, MPC=0.5 ⇒ k = 1÷(1−0.5) = 2 ⇒ ΔY = 1000×2 = Rs.2000m. If MPC rose to 0.8, k=5 and ΔY=5000m – k and MPC are directly proportional.
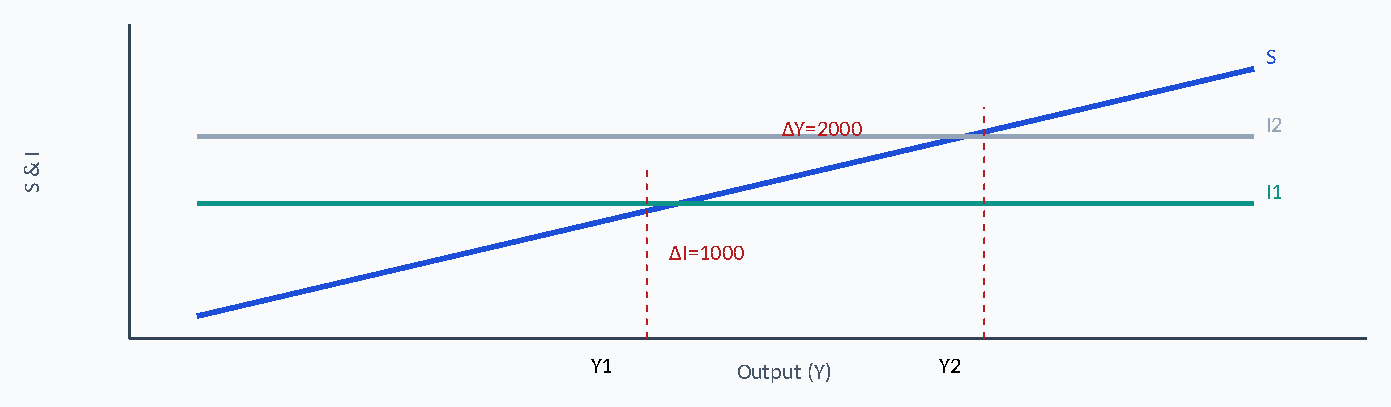
A small rightward shift in investment (I1→I2) along the saving curve S produces a much LARGER increase in equilibrium output (Y1→Y2) – this is the multiplier effect visualised.
Assumptions & Limitations of the Multiplier
📌ASSUMPTIONS
- Constant MPC throughout the process
- Continuous (uninterrupted) spending
- No change in price level
- Full employment NOT yet achieved
- No change in tax rate (stable fiscal policy)
LIMITATIONS
- Ineffective once full employment is reached
- Requires surplus availability of consumer goods
- Time lag between investment and full multiplier effect
Multiplier Extensions: Tax & Import Multipliers
🧾TAX MULTIPLIER (CLOSED ECONOMY WITH GOVERNMENT)
Kt = 1 ÷ (MPS + MPT)
MPT = Marginal Propensity to Tax | Example: MPS=0.3, MPT=0.2 ⇒ Kt = 1÷0.5 = 2
IMPORT MULTIPLIER (OPEN ECONOMY)
Km = 1 ÷ (MPS + MPT + MPM)
MPM = Marginal Propensity to Import | Example: MPS=0.3, MPT=0.2, MPM=0.1 ⇒ Km = 1÷0.6 = 1.67
Exam clue: each extra "leakage" (saving → tax → import) added to the denominator makes the multiplier SMALLER – more leakages mean less of each rupee gets re-spent domestically.
Multiplier Family – Quick Comparison
⚖️| Multiplier | Formula | Applies To |
|---|---|---|
| Investment (k) | 1 ÷ (1−MPC) = 1÷MPS | Simple closed economy (only C & I) |
| Tax (Kt) | 1 ÷ (MPS+MPT) | Closed economy WITH government |
| Import (Km) | 1 ÷ (MPS+MPT+MPM) | Open economy (with foreign trade) |
Accelerator Principle (β)
📌ACCELERATOR
I = f(Y) so ΔI = β(ΔY) or β = ΔI ÷ ΔY
Demand for capital goods is a DERIVED demand – a rise in consumer-goods demand triggers a magnified rise in investment (J.M. Clark)
ASSUMPTIONS
- Constant Capital-Output Ratio (C.O.R.)
- Existing plants operating at FULL capacity
- Surplus availability of resources for new plants
- Flexibility in production (quick response to demand changes)
- Credit money is elastic (funds readily available)
Worked Example: Furniture Industry (C.o.r. = 3:1)
🧪| Year | Demand (000) | Required Capital (000) | Depreciation (000) | Net Investment (000) | Gross Investment (000) |
|---|---|---|---|---|---|
| t | 100 | 300 | – | – | – |
| t+1 | 100 | 300 | 60 | 0 | 60 |
| t+2 | 130 | 390 | 60 | 90 | 150 |
| t+3 | 150 | 450 | 60 | 60 | 120 |
| t+4 | 160 | 480 | 60 | 30 | 90 |
| t+5 | 160 | 480 | 60 | 0 | 60 |
| t+6 | 150 | 450 | 60 | −30 | 30 |
| t+7 | 120 | 360 | 60 | −90 | −30 |
GROSS INVESTMENT
Gross Investment = Net (New) Investment + Depreciation (Replacement Cost)
Net Investment = C.O.R. × change in output per year
Key insight (t → t+2): a 30% rise in demand (100→130) required Net Investment of Rs.90,000, pushing Gross Investment up 150% (60→150) – a small demand change produces a MUCH larger swing in investment. When demand later falls (t+6 to t+7), gross investment can even turn NEGATIVE.
Limitations of the Accelerator Principle
🚧- Ignores adjustment/time-lag costs of installing new machinery
- Spare capacity may absorb demand rise without new net investment
- Becomes ineffective once full employment is reached
- Constant C.O.R. is impractical in the real world
- Only works if the rise in consumer demand is SUSTAINED (temporary spikes are met from existing capacity, not new investment)
Multiplier – Accelerator Interaction
📌↑ AUTONOMOUS INVESTMENT ΔI
↑ INCOME (via Multiplier k) ΔY = k(ΔI)
↑ INDUCED INVESTMENT (via Accelerator β) ΔI = β(ΔY)
(Samuelson) Growing output induces new investment via the accelerator; that new investment raises output further via the multiplier – a self-sustaining cycle. But growth eventually outpaces the economy's productive capacity, forcing investment to scale back – which then triggers a multiplier-driven FALL in output, itself accelerated again. This interaction is the root cause of business cycles.
Business Cycle – the Four Phases
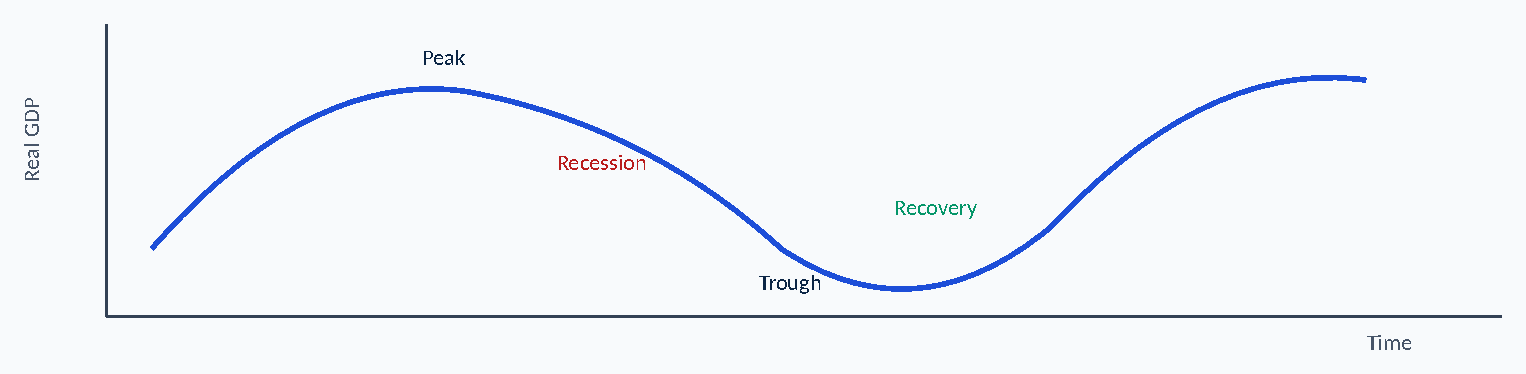
📌
| Phase | Key Characteristics |
|---|---|
| Peak (Boom) | Output, income, employment, prices & profits all rise; easy credit; inflationary pressure; central bank may raise interest rates |
| Downturn (Recession) | Demand falls, firms cut production/investment, credit tightens, job losses; deflationary tendency |
| Trough (Depression) | High unemployment, low income/demand/investment, idle machinery, very low business confidence |
| Recovery (Revival) | Postponed spending resumes, demand & production rise, investment & credit increase, confidence returns |
Over the long run, Real GDP shows an upward trend despite these peak-trough fluctuations – each cycle typically ends at a higher level than the one before.
Exam Patterns & MCQ Quick Clues
🎯"Ratio of change in output to change in investment"
Investment Multiplier (k)
"MPC given, find total change in Y"
Use k = 1/(1−MPC), then ΔY = k×ΔI
"Tax rate also given, along with MPS"
Tax multiplier Kt = 1/(MPS+MPT)
"Imports also mentioned (open economy)"
Import multiplier Km = 1/(MPS+MPT+MPM)
"Change in investment caused by change in demand/output"
Accelerator (β = ΔI/ΔY)
"Credit issued freely, prices/profits rising"
Peak/Boom phase
"High unemployment, idle machinery, low confidence"
Trough/Depression phase
⚠ ECONOMICS EXAM TRAPS
Trap: Confusing Multiplier (ΔI → larger ΔY, driven by MPC) with Accelerator (ΔY → larger ΔI, driven by C.O.R.) – they run in OPPOSITE causal directions.
Trap: Forgetting that each extra leakage (tax, then imports) added to the multiplier's denominator makes k SMALLER, not larger.
Trap: Assuming the multiplier keeps working at full employment – both multiplier AND accelerator become ineffective once full employment is reached.
Trap: Mixing up Net Investment (=C.O.R.×Δoutput) with Gross Investment (=Net Investment+Depreciation) in accelerator calculations.
Trap: Reversing the business cycle phase order – sequence is Peak → Downturn/Recession → Trough → Recovery → back to Peak.
Complete Chapter Decision Tree
📌QUESTION GIVEN → Multiplier, Accelerator, or Business Cycle question? → Identify given values (MPC/MPS/MPT/MPM or C.O.R./ΔY) → Select relevant formula (k, Kt, Km, or β) → Substitute & calculate → For business cycle: identify phase from characteristics described → Interpret & select final answer
PRC-3 ECONOMICS – CHAPTER 7 IN 60 SECONDS
- Multiplier k = ΔY/ΔI = 1/(1−MPC) = 1/MPS.
- k and MPC are directly proportional; higher MPC = bigger multiplier.
- Tax multiplier Kt = 1/(MPS+MPT); Import multiplier Km = 1/(MPS+MPT+MPM).
- Multiplier assumptions: constant MPC, continuous spending, stable prices, below full employment, stable tax.
- Accelerator β = ΔI/ΔY; driven by a constant Capital-Output Ratio.
- Gross Investment = Net Investment + Depreciation.
- Multiplier-Accelerator interaction: ΔI→ΔY(k)→ΔI(β) – explains business cycles.
- 4 Business Cycle phases: Peak → Downturn/Recession → Trough/Depression → Recovery.
- Both multiplier and accelerator become ineffective AT full employment.
Chapter Memory Map
🧠Preparing for ICAP PRC-3?
Join Learning League for chapter-wise classes, practice MCQs and tests on our student portal. Message us on WhatsApp to enrol.