Chapter Roadmap
🧭MACROECONOMICS & OBJECTIVES
NATIONAL INCOME CONCEPTS (GDP/GNP/NNP/PI/DPI)
CIRCULAR FLOW & MEASUREMENT
AD/AS & NATIONAL INCOME EQUILIBRIUM
Theme: this is our first Macroeconomics chapter – moving from individual markets to the economy as a whole. It builds the vocabulary to measure a country's total output (GDP/GNP/NNP), traces how income circulates between firms and households, and shows how Aggregate Demand and Aggregate Supply together determine the equilibrium level of national income and price.
Key Definitions
📘Macroeconomics
Studies the behaviour of the economy as a whole (aggregate output, unemployment, inflation) – contrasts with microeconomics' individual-market focus.
National Income
(Samuelson) The market value of all final goods and services produced in a country during a given period, usually one year.
Effective Demand (Keynes)
Actual expenditure in an economy based on EXISTING/actual income – not on the assumption that all resources are fully utilised.
Full Employment (Yf)
Situation where all available resources of an economy are fully utilized – no more production is possible.
Aggregate Demand (AD)
Total amount of goods and services demanded in an economy at a given price level, in a given time period.
Aggregate Supply (AS)
Total supply of goods and services produced within an economy at a given price level, in a given time period.
Output Gap
Difference between an economy's actual output and its production potential (Yf).
Circular Flow of Income
Continuous flow of payments between firms (which pay for factors of production) and households (which pay for goods/services).
Macroeconomic Objectives
📌ECONOMIC GROWTH
- Raises national wealth & standard of living
LOW PRICE INFLATION
- Some inflation is normal; high inflation erodes wealth & confidence
LOW UNEMPLOYMENT
- Wasted resource + social cost; higher employment ↑ AD & growth
EQUILIBRIUM IN BALANCE OF PAYMENTS
- Balance between earnings from exports/inflows and payments for imports/outflows
National Income Building Blocks – Formula Chain
🧮GROSS DOMESTIC PRODUCT
GDP = C + I + G + (X − M)
Value of output produced WITHIN the country's borders (domestic resources only) – excludes nationals' income earned abroad
GROSS NATIONAL PRODUCT
GNP = GDP + Net Income from Abroad
Broader than GDP – includes ALL income earned by a country's nationals, at home or abroad
REAL GDP (GDP DEFLATOR)
Real GDP = Nominal GDP ÷ GDP Deflator
Nominal GDP = current prices (includes inflation) | Real GDP = inflation-adjusted, base-year prices – the accurate growth indicator
NET NATIONAL PRODUCT
NNP = GNP − Depreciation
Depreciation = capital consumption (wear/decline in asset value used to produce output)
Worked Example: GDP → GNP → NNP
🧪| Item | Rs. bn |
|---|---|
| GDP | 500 |
| + Net income from abroad (250 received − 200 paid) | +50 |
| = GNP | 550 |
| − Depreciation (plant 20 + building 30) | −50 |
| = NNP | 500 |
Key Rules for National Income Accounting
📌- National income, national output, and national product are synonyms
- Only MONEY VALUE is used (physical units can't be added/subtracted)
- Only FINAL goods and services are counted (avoid double counting)
- Measured for ONE YEAR only
- Only LEGAL production is included
Market Price vs Factor Cost
🔍CONVERTING BETWEEN MP AND FC
NNPfc = NNPmp − Indirect Tax + Subsidies | NNPmp = NNPfc + Indirect Tax − Subsidies
Indirect tax (sales tax, excise duty) takes income away from producers; subsidies give it back
Personal Income & Disposable Personal Income
📌PERSONAL INCOME (PI)
PI = NI − Corporate Profit Tax − Undistributed Profit − Social Security Contributions + Transfer Payments
Transfer payments = "unearned income" (pensions, gifts, scholarships) received without any economic activity
DISPOSABLE PERSONAL INCOME (DPI OR YD)
DPI = PI − Personal Taxes (or) Yd = Y − T
The net amount households can freely save or consume, after direct/personal taxes
| Step | Rs. bn |
|---|---|
| National Income | 500 |
| − Corporate profit tax (50) − Undistributed profit (30) − Social security (25) | −105 |
| + Transfer payments | +45 |
| = Personal Income | 440 |
| − Personal taxes (income tax 80 + property tax 60) | −140 |
| = Disposable Personal Income | 300 |
Per-capita Income
📌PER-CAPITA INCOME
Per Capita Income = National Income ÷ Population
Proxy for average standard of living | Example: Rs.240bn ÷ 120 million = Rs.2,000
Circular Flow of National Income
📌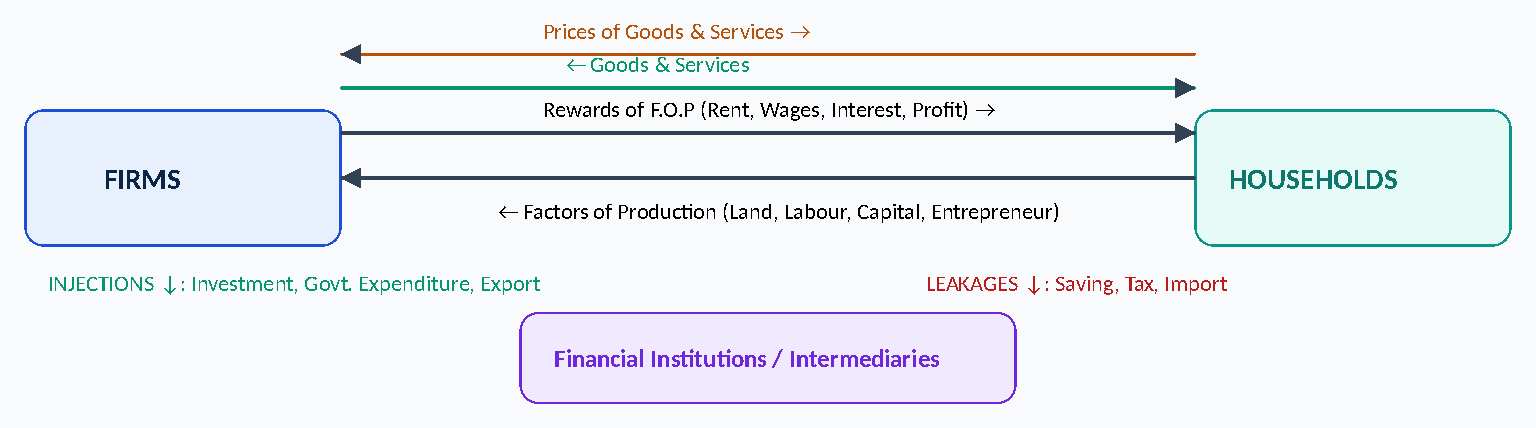
Households supply factors of production to firms and receive rewards (rent, wages, interest, profit); they spend this income on goods & services, which becomes firms' revenue. Injections (investment, govt. spending, exports) add to the flow via financial institutions; leakages (saving, tax, imports) withdraw from it.
Injections vs Leakages
⚖️| Injections (add to circular flow) | Leakages (withdraw from circular flow) |
|---|---|
| Investment (I) | Saving (S) |
| Government Expenditure (G) | Tax (T) |
| Exports (X) | Imports (M) |
Money value of final goods & services = aggregate rewards to factors of production, IF all rewards are paid in full – this equivalence is the basis for all 3 measurement approaches (next page).
Three Approaches to Measure National Income
📏MEASURING NATIONAL INCOME
Product Approach
Add money value of FINAL goods & services from agriculture, manufacturing, individual & institutional services. GDPmp → +Net income abroad = GNPmp → −Depreciation = NNPmp.
Income Approach
Add rewards received by ALL factors of production: Rent +
Wages + Interest + Pre-tax Profit = National Income at FACTOR COST. Excludes transfer payments & illegal income.
Expenditure Approach
Add total expenditure by all agents: Y = C + I + G + (X−M). Excludes spending on used/second-hand goods.
If all precautions are correctly applied, all THREE approaches give the SAME national income figure.
Value-added Approach – Avoiding Double Counting
📌| Stage | Total Output (market value) | Value Added |
|---|---|---|
| Cotton | 100 | 100 |
| Yarn | 200 | 100 |
| Fabric | 250 | 50 |
| Shirt | 380 | 130 |
| Total | Wrongly = 700 if summed directly (double-counts inputs) | Correctly = 380 (sum of value added = final product value) |
Exam clue: the sum of all value-added at each production stage always equals the market value of the FINAL product – this is how double/multiple counting is avoided.
Precautions in National Income Measurement
📏PRODUCT APPROACH
- Avoid double counting
- Exclude free/unpaid services (housework, etc.)
- Exclude sale of old/used goods
INCOME APPROACH
- Exclude transfer payments
- Exclude income from illegal activities
EXPENDITURE APPROACH
- Avoid double counting
- Only NEWLY produced goods (exclude resold/used goods)
Difficulties in Measuring National Income
📌- Lack of trained statistical staff
- Illiteracy / unreliable record-keeping by producers
- Inadequate data-collection infrastructure
- Illegal activities excluded (undocumented/black/shadow economy)
- Barter transactions ignored or estimated
- Frequent price fluctuations complicate accurate calculation
- Foreign firms' earnings hard to classify (in/out of national income)
Importance of National Income Measurement
📏ASSESS PERFORMANCE
- Rising NI = economy growing
LIVING STANDARDS
- Per-capita income (NI ÷ population)
INCOME DISTRIBUTION
- How output is shared among factors of production
ECONOMIC PLANNING
- Basis for monetary, fiscal & commercial policy
INTERNATIONAL COMPARISON
- Compare growth across countries
Measurement Approaches – Quick Reference
📏| Approach | What's Added | Gives You |
|---|---|---|
| Product | Agriculture + Manufacturing + Services | GDPmp → GNPmp → NNPmp |
| Income | Wages + Rent + Interest + Profit (excl. transfers) | National Income at FACTOR COST |
| Expenditure | Consumption + Investment + (Exports−Imports) | GNP (less Indirect Tax + Subsidies for FC) |
Aggregate Demand (AD) – Components & Shifts
📌COMPONENTS OF AGGREGATE DEMAND
AD = C + I + G + (X − M)
Same components as GDP – AD is a measure of everything demanded/spent in the economy
Consumer income ↑ / Firms optimistic (invest more) / Govt. spending ↑ / Exports more attractive / Imports less desirable
AD curve SHIFTS RIGHT (AD1→AD2), same price level
AD curve: downward sloping (price level on Y-axis, real national output on X-axis) – like a regular demand curve, but for the WHOLE economy.
Aggregate Supply (AS) – SRAS vs LRAS
⚖️| Short-Run AS (SRAS) | Long-Run AS (LRAS) | |
|---|---|---|
| Slope | Upward sloping (like normal supply) | VERTICAL at full employment (Yf) |
| Price dependency | Positively related to price level | Independent of price level |
| Represents | Output firms will supply at current prices/costs | The economy's maximum productive potential |
| Shift factors | Factor productivity, capital stock, labour force, wages, producer taxes/subsidies, inflation expectations | Labour skills, technology, new natural resources |
Keynesian AS view: AS is flat/elastic BELOW full employment (spare capacity absorbs extra output without raising prices) and becomes vertical only once the economy nears full employment/Yf.
National Income Equilibrium & Output Gaps
📌Equilibrium occurs where AD = SRAS (and ideally close to LRAS, the full-employment potential Yf).
| Gap Type | Condition | Cause | Effect on Price Level |
|---|---|---|---|
| Negative / Deflationary Gap | AD < Yf (potential output) | Recession – resources under-utilised, low AD | Price level FALLS |
| Positive / Inflationary Gap | AD > Yf (potential output) | Expansionary boom – AD outstrips available resources | Price level RISES |
Recession (e.g. COVID-19) → consumption & investment shrink
AD falls (AD0→AD1) → price level falls (P0→P1) → Deflationary Gap
Investor optimism / rapid growth
AD rises beyond Yf → resources insufficient → price level rises → Inflationary Gap
Changes in AD & SRAS – Effect on Equilibrium
🔁| Change | Effect on Price | Effect on Output |
|---|---|---|
| AD increases (shifts right) | Rises | Rises (movement along SRAS) |
| SRAS increases (shifts right) | Falls | Rises (movement along AD) |
Exam Patterns & MCQ Quick Clues
🎯"Market value of ALL final goods/services in a year"
National Income / GDP
"Includes nationals' income earned abroad"
GNP (not GDP)
"Deduct capital consumption"
NNP = GNP − Depreciation
"AD > potential/full-employment output"
Inflationary (positive) gap
"Curve is vertical, independent of price"
LRAS (at full employment)
"Unearned income, no economic activity performed"
Transfer payment
⚠ ECONOMICS EXAM TRAPS
Trap: Confusing GDP (domestic resources only) with GNP (includes nationals' income earned abroad).
Trap: Forgetting to exclude transfer payments and illegal income when using the Income Approach.
Trap: Mixing up Market Price (includes indirect tax, excludes subsidy effect) vs Factor Cost adjustments – remember NNPfc = NNPmp − Indirect Tax + Subsidies.
Trap: Treating SRAS and LRAS the same – SRAS is upward-sloping and price-dependent; LRAS is VERTICAL and price-independent.
Trap: Reversing deflationary vs inflationary gap – AD<Yf is deflationary (price falls); AD>Yf is inflationary (price rises).
Complete Chapter Decision Tree
📌QUESTION GIVEN → Which concept (GDP/GNP/NNP/PI/DPI, measurement approach, or AD/AS)? → Identify given figures → Select the relevant formula → Substitute & calculate step by step → For AD/AS: identify shift cause & direction → Determine effect on price & output → Interpret & select final answer
PRC-3 ECONOMICS – CHAPTER 5 IN 60 SECONDS
- GDP = C+I+G+(X−M); domestic resources only.
- GNP = GDP + net income from abroad.
- NNP = GNP − Depreciation.
- NNPfc = NNPmp − Indirect Tax + Subsidies.
- PI = NI − corp. tax − undistributed profit − social security + transfers.
- DPI = PI − personal taxes.
- Per-capita income = NI ÷ Population.
- 3 approaches: Product, Income, Expenditure – all give the same NI if precautions followed.
- Injections: I, G, X. Leakages: S, T, M.
- AD downward sloping; SRAS upward sloping; LRAS vertical at Yf.
- Deflationary gap: AD<Yf, price falls. Inflationary gap: AD>Yf, price rises.
Chapter Memory Map
🧠Preparing for ICAP PRC-3?
Join Learning League for chapter-wise classes, practice MCQs and tests on our student portal. Message us on WhatsApp to enrol.