Chapter Roadmap
🧭INFLATION
(measurement, degrees, causes)
UNEMPLOYMENT
(types, effects, remedies)
PHILIPS CURVE
(inflation-unemployment trade-off)
Theme: this chapter examines the value of money through inflation (a persistent rise in prices, eroding money's value) and unemployment (joblessness despite willingness to work). The Philips Curve then links the two, showing a short-run trade-off policymakers must navigate.
Key Definitions
📘Inflation
A measure of the rate of increase in the general price level of a predetermined basket of goods & services – a PERSISTENT, absolute rise (not one good, not one year).
Consumer Price Index (CPI)
A measure of the weighted average of prices of a basket of goods and services; changes are measured relative to an index of 100.
Stagflation
Slow economic growth + high unemployment + higher inflation + reduced GDP, occurring together.
Demand-Pull Inflation
Inflation arising from a rise in aggregate demand pulling the price level upward.
Cost-Push Inflation
Inflation arising from a rise in the cost of production (supply-side).
Wage-Price Spiral
Self-perpetuating cycle: wages ↑ → disposable income ↑ → demand & prices ↑ → workers demand higher wages again.
Unemployment
A situation where an able-bodied person, actively searching for a job, is unable to find work.
Natural Rate of Unemployment
Frictional (voluntary) + Structural unemployment combined – an unavoidable baseline level of unemployment in any economy.
Measuring Inflation Via CPI
📈PRICE INDEX OF A YEAR
Price Index = Σ(Price × Weight) ÷ ΣWeights
Items are WEIGHTED because some (food) affect cost of living more than others (housing, bought infrequently)
RATE OF INFLATION
Rate of Inflation = [(Price Index Current Year − Price Index Last Year) ÷ Price Index Last Year] × 100
Measured ANNUALLY – represents the year-on-year change in the basket's price
Worked example: Current-year Price Index = Σ(Price×Weight)/100 = 9147/100 = 91.5. Last year's index was 89.5 ⇒ Rate of Inflation = [(91.5−89.5)/89.5]×100 = 2.2%.
Limitations of CPI
🚧- Not fully representative: "average" basket doesn't reflect every household's actual spending (single vs married, rich vs poor)
- Changing quality of goods: a price rise from quality IMPROVEMENT can be wrongly counted as inflation
- Index-number problems: choice of "base year" is debatable and can distort values
- Spending pattern: ignores individual variation in what people actually buy
Degrees of Inflation
📈| Degree | Definition |
|---|---|
| Moderate/Low Inflation | Rate stays within 1%–20% p.a.; below 5% = "creeping"; above 5% = "trotting" |
| Hyperinflation | Uncontrollable, extremely rapid price rise (even weekly/monthly) – money loses its store-of-value function (e.g. Zimbabwe 2008: ~79,600,000,000%) |
| Deflation | Contrary to inflation – average price level consistently DECREASES |
| Stagflation | Slow growth + high unemployment + high inflation + falling GDP together |
Effects of Inflation – Who Wins, Who Loses
📈REAL INTEREST RATE
Real Interest = Nominal Interest − Inflation
Explains why debtors/creditors are affected oppositely by inflation
| Agent | Effect of Inflation |
|---|---|
| Debtors | BENEFIT – repay loans in money worth LESS in real terms |
| Creditors | SUFFER – receive repayments worth less in real terms |
| Entrepreneurs | Less likely to commit to big projects under high/volatile inflation (uncertainty) |
| Fixed-income group | Regressively hurt – especially if food/utility prices rise sharply |
| Investors | Face higher borrowing costs if government raises interest rates to fight inflation |
| Government | Purchasing power of spending falls; must cut expenditure, slowing development |
| Business competitiveness | Higher domestic inflation than rivals → higher relative prices → WEAKER international competitiveness |
Demand-pull Inflation
📈Rising AD pulls the price level upward; gets worse if AS doesn't respond, and MORE severe once full employment is reached.
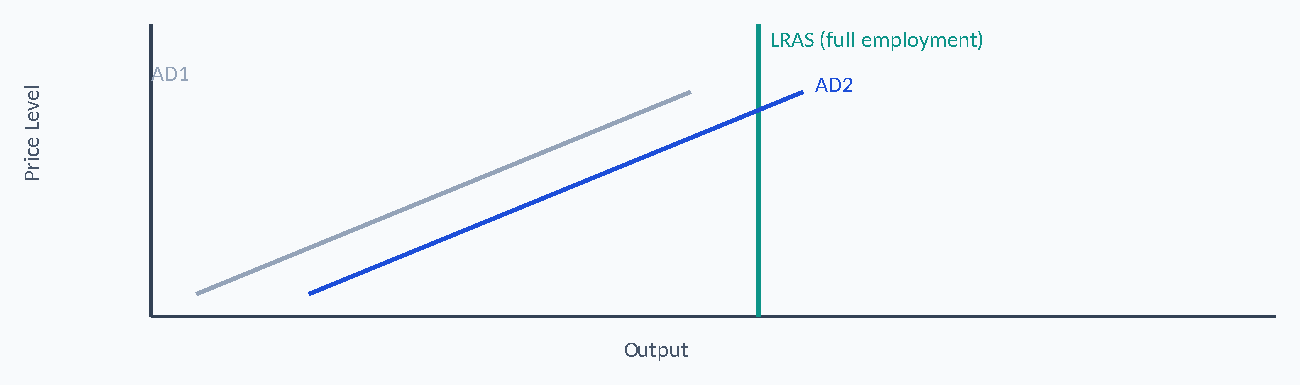
CAUSES
- Fiscal stimulus (govt. spending ↑, magnified by multiplier)
- Monetary stimulus (interest rates ↓)
- Exchange rate depreciation (exports cheaper → AD ↑)
- Fast growth in trading-partner countries (exports ↑)
REMEDIES
- Raise interest rates (investment ↓)
- Raise taxes (disposable income & spending ↓)
- Reduce money supply
- Increase direct taxes (consumption & AD ↓)
Cost-push Inflation
📈Rising cost of production (wages, inputs) discourages output; SRAS shifts inward/left, creating shortage and pushing price up.
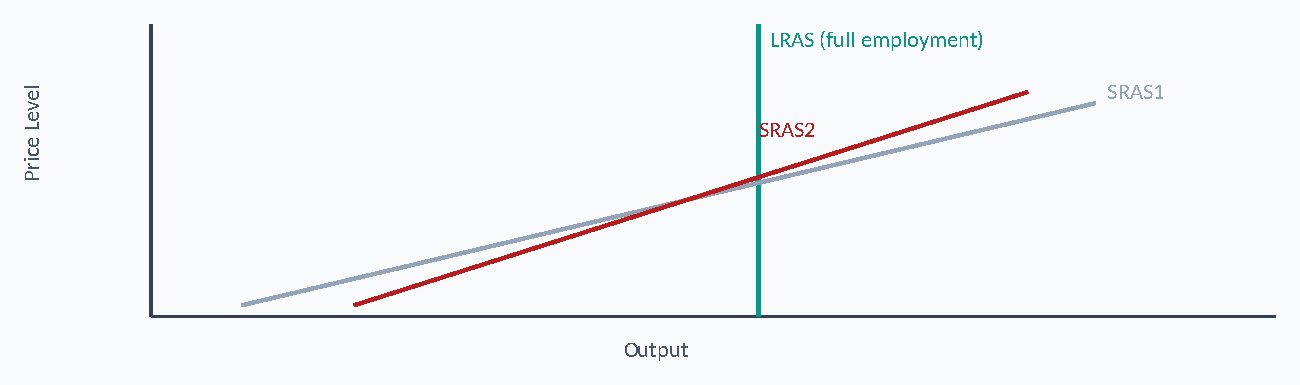
SRAS1 shifts left/upward to SRAS2, dragging price from P1 up to P2 as output contracts.
CAUSES
- Rising labour costs (low unemployment → higher wage demands)
- Expectations of inflation (wage-price spiral)
- Rising component/raw material costs
- Higher indirect taxes (e.g. fuel duty)
- Rising import costs (currency depreciation)
REMEDIES
- Limit wage increases
- Limit/control utility (energy) costs
- Reduce import costs (allow currency to appreciate)
- Provide subsidies & reduce indirect taxes
Wage-price Spiral – Cause & Effect
🔁Wages ↑
Disposable income ↑ → demand & prices ↑
Workers demand higher wages again – cycle repeats (self-perpetuating)
Measuring Unemployment
📌UNEMPLOYMENT RATE
Unemployment Rate = (Unemployed Labour Force ÷ Total Labour Force) × 100
Types of Unemployment
🧩UNEMPLOYMENT
Long-Run (Permanent)
Demand-deficient: recession → firms cut output & labour
Structural: skills mismatch by location/technology
Real wage (Classical): wages kept artificially high (e.g. unions) → labour demand < supply
Short-Run (Temporary)
Seasonal: arises from seasonal variation
Frictional: searching/transitioning between jobs
Voluntary: choosing not to work at the prevailing wage (e.g. prefers social security)
Real-wage unemployment graph: without intervention, wage = W1 (equilibrium). A minimum wage set ABOVE market rate (Wm) makes labour demand LESS than labour supply, creating unemployment equal to the gap (Supply of Labour − Demand for Labour) at Wm.
Effects & Remedies of Unemployment
🔁EFFECTS
- Loss of GDP; government tax-collection shortfall
- Increased poverty
- Greater income-distribution disparities
- Worsens current account deficit (output falls)
- Social evils (theft, crime) rise
REMEDIES
- Promote labour-intensive technology
- Agricultural reforms (multiple cropping vs seasonal unemployment)
- On-job/off-job training (address structural mismatch)
- Promote self-employment schemes
- Control population growth
Philips Curve Approach
📈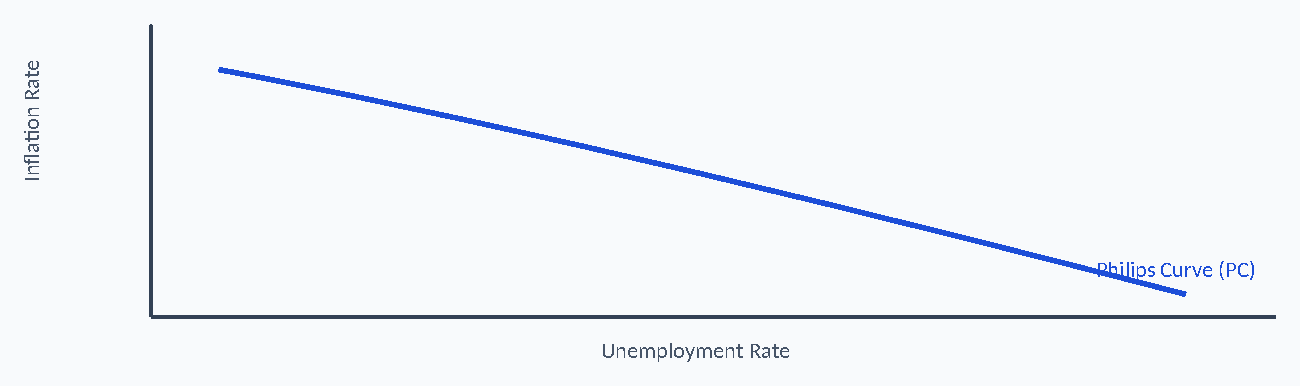
(A.W. Phillips, 1958) Inverse relationship between inflation and unemployment – reducing unemployment (e.g. via govt. spending on jobs) raises labour demand, pushes wages up, and causes cost-push inflation. This is the short-run "trade-off": more inflation ↔ less unemployment, and vice versa.
Natural Rate of Unemployment
📌Natural rate = Frictional (voluntary) + Structural unemployment. This level is UNAVOIDABLE – even in a healthy economy, some people are between jobs or mismatched by skill/location. These people are considered a form of "voluntary" unemployment since they are, in theory, choosing not to take available work at the prevailing wage/location.
Exam Patterns & MCQ Quick Clues
🎯"Rise in AD pulls price level up"
Demand-Pull Inflation
"Rising wages/input costs push price up"
Cost-Push Inflation
"High unemployment + high inflation + low growth"
Stagflation
"Skills mismatch by location/technology"
Structural unemployment
"Minimum wage set above equilibrium"
Real-wage (classical) unemployment
"Reducing unemployment raises inflation"
Philips Curve trade-off
⚠ ECONOMICS EXAM TRAPS
Trap: Confusing Demand-Pull (AD-side) with Cost-Push (AS-side) inflation – check whether the graph shifts AD or SRAS.
Trap: Forgetting inflation must be PERSISTENT and measured against a BASKET of goods, not a single good's one-off price rise.
Trap: Assuming debtors and creditors are affected the SAME way by inflation – debtors benefit, creditors lose.
Trap: Mixing up frictional (temporary, job search) with structural (skills/location mismatch) unemployment – both are part of the "natural rate" but arise differently.
Trap: Treating the Philips Curve trade-off as a LONG-run relationship – the source describes it specifically as a SHORT-run phenomenon.
Complete Chapter Decision Tree
📌QUESTION GIVEN → Inflation, unemployment, or Philips Curve question? → For inflation: demand-side or supply-side cause? → For unemployment: long-run or short-run type? → Apply relevant formula (CPI, inflation rate, unemployment rate) if numerical → Interpret & select final answer
PRC-3 ECONOMICS – CHAPTER 10 IN 60 SECONDS
- Inflation: persistent rise in general price level; measured via CPI.
- Rate of inflation = %Δ in price index year-on-year.
- Degrees: Moderate (creeping<5%, trotting>5%), Hyperinflation, Deflation, Stagflation.
- Debtors gain, Creditors lose from inflation (real interest = nominal − inflation).
- Demand-pull: AD↑ (fiscal/monetary stimulus, exports). Cost-push: SRAS↓ (wages, input costs).
- Wage-price spiral: wages↑→demand/prices↑→wages↑ again.
- Unemployment rate = Unemployed/Total Labour Force ×100.
- Long-run: demand-deficient, structural, real-wage. Short-run: seasonal, frictional, voluntary.
- Natural rate = Frictional + Structural (unavoidable baseline).
- Philips Curve: inverse inflation-unemployment trade-off (short run).
Chapter Memory Map
🧠Preparing for ICAP PRC-3?
Join Learning League for chapter-wise classes, practice MCQs and tests on our student portal. Message us on WhatsApp to enrol.